How to Make the World Add Up - Tim Harford
📝 Notes
Introduction: How to Lie with Statistics
Darrell Huff published How to Lie with Statistics in 1954. But something else happened that very same year: two British researchers, Richard Doll and Austin Bradford Hill, produced one of the first convincing studies to demonstrate that smoking cigarettes causes lung cancer.
The approach of Huff makes the analysis of statistics into a charade and not as seriously as the matter requires. We must separate emotions from reason and not interpret all statistics or information on numerical subjects as attempts to fool us like a magic trick.
Rule 1 - Search your feelings
Control your emotions about statistical claims you see.
How do I feel about what I am seeing? Are my feelings causing undetected bias on my side?
Ostrich Effect
Motivated Reasoning
Confirmation Bias
Stoic Principles applied to reviewing data
But we shouldn’t despair. We can learn to control our emotions—that is part of the process of growing up. The first simple step is to notice those emotions. When you see a statistical claim, pay attention to your own reaction. If you feel outrage, triumph, denial, pause for a moment. Then reflect. You don’t need to be an emotionless robot, but you could and should think as well as feel. Stoicism
Cognitive Reflection Test
When we encounter a statistical claim about the world and are thinking of sharing it on social media or typing a furious rebuttal, we should instead ask ourselves, “How does this make me feel?”*
Analyze your feelings about a statistic or fact. How do you feel and why do you feel that way?
Rule 2 - Ponder your personal experience
Naive Realism
Rule 3 - Avoid premature enumeration
Rule 4 - Step back and enjoy the view
The good stories are everywhere. They are not made memorable by their rarity; they are made forgettable by their ubiquity. Good things happen so often that they cannot seriously be considered for inclusion in a newspaper
Rarity or ubiquity of good stories?
So however much news you choose to read, make sure you spend time looking for longer-term, slower-paced information. You will notice things—good and bad—that others ignore
Look for slower paced information as it is most of the time more reliable.
Rule 5 - Get the back story
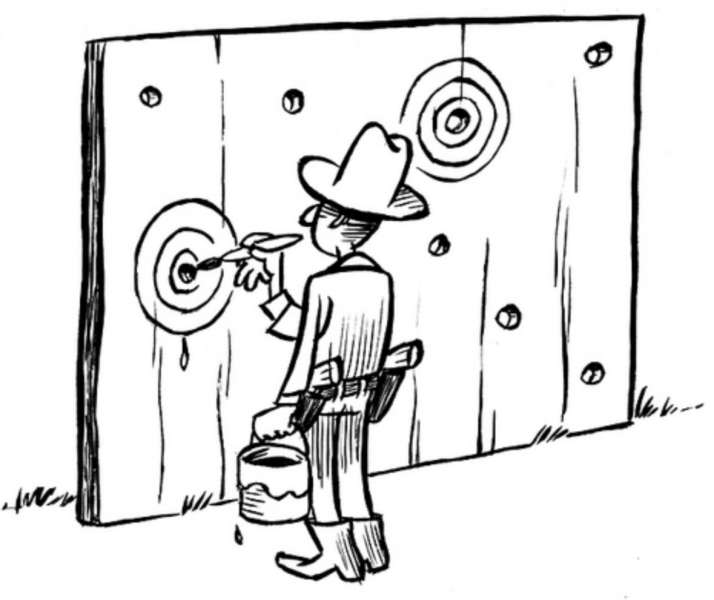
Survivorship Bias
There’s a famous story about the mathematician Abraham Wald, asked in 1943 to advise the US air force on how to reinforce their planes. The planes were returning from sorties peppered with bullet holes in the fuselage and wings; surely those spots could use some armour plating? Wald’s written response was highly technical, but the key idea is this: we only observe damage in the planes that return. What about the planes that were shot down? We rarely see damage to the engine or fuel tanks in planes that survive. That might be because those areas are rarely hit – or it might be that whenever those areas are hit, the plane is doomed. If we look only at the surviving planes – falling prey to ‘survivorship bias’ – we’ll completely misunderstand where the real vulnerabilities are.
The rabbit-hole goes deeper. Even the story about survivorship bias is an example of survivorship bias; it bears little resemblance to what Abraham Wald actually did, which was to produce a research document full of complex technical analysis. That is largely forgotten. What survives is the tale about a mathematician’s flash of insight, with some vivid details added. What originally existed and what survives will rarely be the same thing.So the story goes, as told by Stephen Sigler, Nature May 1989:
"The US military studied fighter planes returning from missions to try to improve their survival rate and were considering adding heavy armour to those parts of the plane that tended to show the greatest concentration of hits from enemy fire, until statisticians pointed out the fallacy of that argument. The more vulnerable parts of the plane were those with the fewest hits; planes hit there tended not to return at all. The single most vulnerable part, the pilot’s head, was without serious scar in the sample of planes that returned."
It’s easy to draw correlations from what we see in front of us. But what we see usually represents just a small part of what has happened. Focusing on the evidence we can easily see at the expense of that we can’t leads to survivorship bias. To say it another way, when Bill Gates drops out of college and starts Microsoft it might seem like dropping out is a path to success for others too, but that ignores all the dropouts who didn’t create Microsofts and consequently you didn’t hear about.
Silent evidence — the evidence that we don’t or can’t easily choose to consider — is a term from Nicholas Nassim Talleb.
When trying to discover the veracity of the planes story I enjoyed Bill Casselman’s American Mathematical Society article on The Legend of Abraham Wald. The postscript points to some of the source behind the story including a mention of Stephen Sigler’s letter in Nature quoted above.
I covered survivorship bias before but like this story so much I thought it was worth doing again.
HARKING - Hypothesising After Results Known
This leads to yet another kind of publication bias: if a particular way of analysing the data produces no result, and a different way produces something more intriguing, then of course the more interesting method is likely to be what is reported and then published.
Scientists sometimes call this practice ‘HARKing’ – HARK is an acronym for Hypothesising After Results Known
HARKing
Andrew Gelman, a statistician at Columbia University, favours the term ‘the garden of forking paths’, named after a short story by Jorge Luis Borges. Each decision about what data to gather and how to analyse them is akin to standing on a pathway as it forks left and right and deciding which way to go. What seems like a few simple choices can quickly multiply into a labyrinth of different possibilities. Make one combination of choices and you’ll reach one conclusion; make another, equally reasonable, and you might find a very different pattern in the data.
The garden of forking paths
Rule 6 - Ask who is missing
But we should draw conclusions about human nature only after studying a broad range of people. Psychologists are increasingly acknowledging the problem of experiments that study only ‘WEIRD’ subjects – that is, Western, Educated and from Industrialised Rich Democracies.
This means opinion pollsters need to deal with two issues: sample error and sample bias.
Sample error reflects the risk that, purely by chance, a randomly chosen sample of opinions does not reflect the true views of the population.
Sample error in polls.
Sampling error is when a randomly chosen sample doesn’t reflect the underlying population purely by chance; sampling bias is when the sample isn’t randomly chosen at all.
Sampling error and sampling bias
One thing is certain. If algorithms are shown a skewed sample of the world, they will reach a skewed conclusion
Rule 7 - Demand transparency when the computer says 'no'
An algorithm, meanwhile, is a step-by-step recipe* for performing a series of actions, and in most cases ‘algorithm’ means simply ‘computer program’. But over the past few years, the word has come to be associated with something quite specific: algorithms have become tools for finding patterns in large sets of data.
So far we’ve focused on excessive credulity in the power of the algorithm to extract wisdom from the data it is fed. There’s another, related problem: excessive credulity in the quality or completeness of the dataset.
Computers trained on our own historical biases will repeat those biases at the very moment we’re trying to leave them behind us.
When Newton famously declared ‘if I have seen further it is by standing on the shoulders of giants’, this was true only of his scientific work. As an alchemist, he stood on nobody’s shoulders and saw little.
Rule 8 - Don't take statistical bedrock for granted
Rule 9 - Remember that misinformation can be beautiful too
Rule 10 - Keep an Open Mind
The Golden Rule: Be curious
First, we should learn to stop and notice our emotional reaction to a claim, rather than accepting or rejecting it because of how it makes us feel.
Second, we should look for ways to combine the ‘bird’s eye’ statistical perspective with the ‘worm’s eye’ view from personal experience.
Third, we should look at the labels on the data we’re being given, and ask if we understand what’s really being described.
Fourth, we should look for comparisons and context, putting any claim into perspective.
Fifth, we should look behind the statistics at where they came from – and what other data might have vanished into obscurity.
Sixth, we should ask who is missing from the data we’re being shown, and whether our conclusions might differ if they were included.
Seventh, we should ask tough questions about algorithms and the big datasets that drive them, recognising that without intelligent openness they cannot be trusted.
Eighth, we should pay more attention to the bedrock of official statistics – and the sometimes heroic statisticians who protect it.
Ninth, we should look under the surface of any beautiful graph or chart.
And tenth, we should keep an open mind, asking how we might be mistaken, and whether the facts have changed.
Summary of the 10 rules
📋 Table of Contents
ℹ️ About
I already read several books by @Tim Harford and was drawn to this one which interestingly has a US version called "Data Detective" and an international version called "How to make the World Add Up".